Geoportal
The MDI-DE geoportal primarily provides a joint search for official data and maps from state and federal agencies with coastal and marine responsibilities. The search results can be displayed in maps and downloaded.
Systematic search
The search functionality is realized with the metadata system NOKIS based on the service-oriented software platform InGrid and the Coastal Gazetteer. During the search, the metadata catalog of the geoportal takes into account the information of all member authorities. The search function is supported by a quick search and suitable filter options in order to clearly categorize, target and refine search results. The hit lists link directly to download and to visualization in the geoportal.
The start page shows the variety of topics and functionalities of the MDI-DE and offers the following entry points to the geoportal:
Topic categories
Web services on a wide variety of topics are integrated in the MDI-DE geoportal. They are categorized according to basic data, geology, coastal engineering, nature and environment, oceanography, human activities, guidelines, and shipping.
A compilation of available services in the MDI-DE is published in the product catalog. This catalog is generated on-the-fly from the associated metadata.
Use cases and FAQs
A description of how to use web services from a geodata infrastructure often uses technical vocabulary that is not always easy to understand. In order to facilitate access to the data for applications in their own geoinformation systems (GIS) for as many interested parties as possible, some information is provided below in the form of FAQs.
Web Map Service (WMS) and Web Map Tile Service (WMTS) describe an interface through which prefabricated maps are provided in a layout preconfigured by the publisher (symbols, labeling, data aggregation). This form of data source can usually be integrated directly into a GIS application as an independent layer. A WMS or WMTS is primarily suitable for display. In order to use this data source, a connection to the Internet must exist.
Web Feature Service (WFS) is an interface for downloading data for your own analyses and/or for inclusion in GIS applications. To use this data source, you must be connected to the Internet. For large data sets, longer response times may have to be expected.
In the metadata search, you can either search for WMS or WFS directly in the search field, or you can use the filter options to display the results that describe a WMS or WFS data source. In the metadata of the search hits, the distribution information of the format (e.g. WMS) and the corresponding online ressource are displayed. In addition, the metadata should include a link that says “getCapabilities” or a link that includes the string “wms” in its address. You can copy this link completely and use it at the appropriate place in your GIS to integrate the desired data locally.
As described above, the metadata describing a web service should produce a link that allows access to the data. The copied link can be pasted into a GIS project as shown in the two examples below:
Example QGIS (version 3.16):
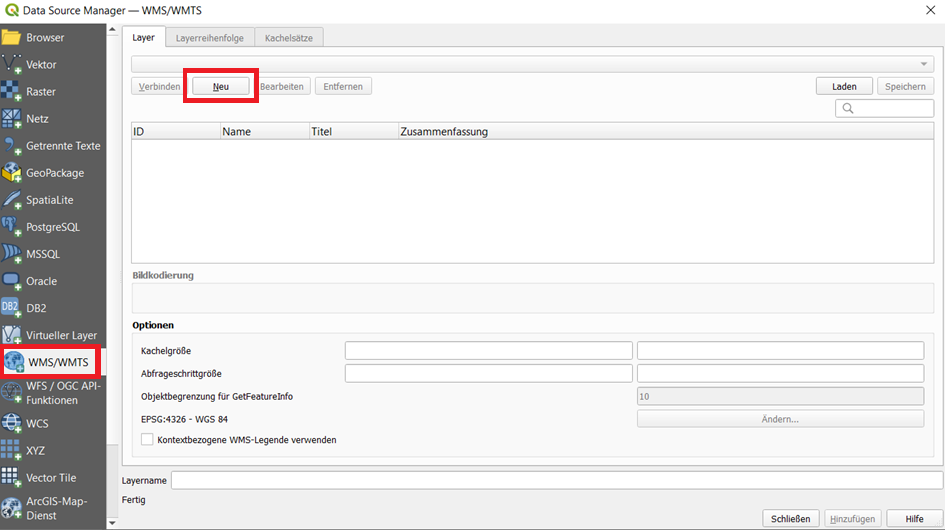
Step 1: Menu: Layer -> Data Source Management, Shortcut: CTRL-L
- Selection of the data source type, here WMS/WMTS for a presentation service.
- Create new connection
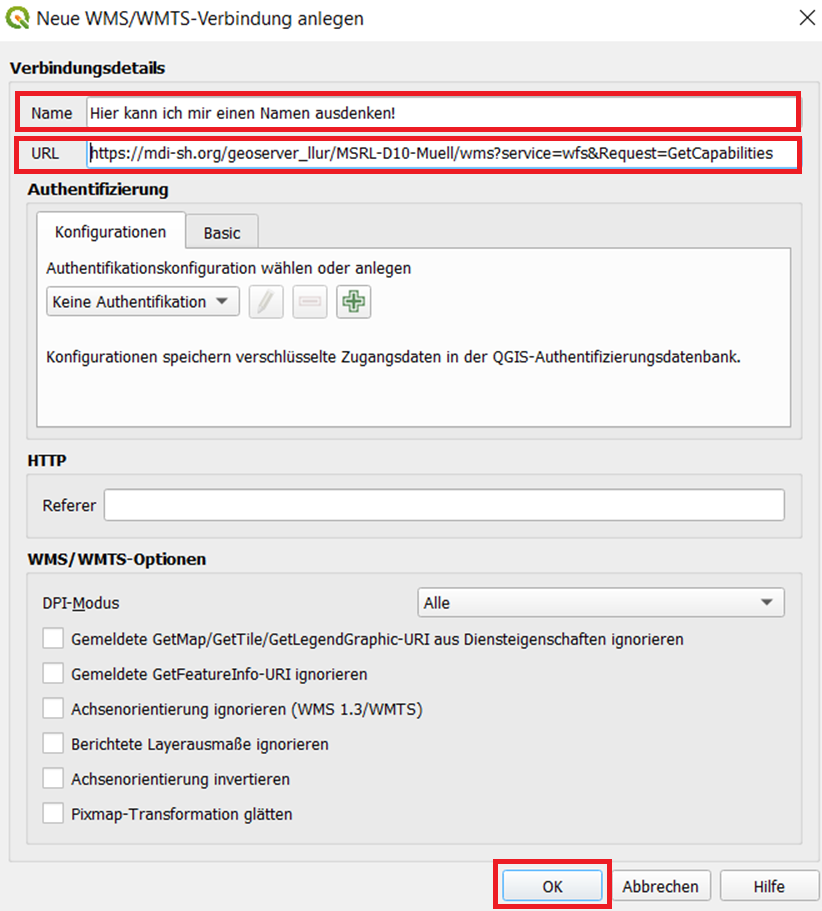
Step 2: Create a new data connection
- Enter the name for the service as you want to manage it in your project.
- Copy link/URL for the service here (getCapabilities)
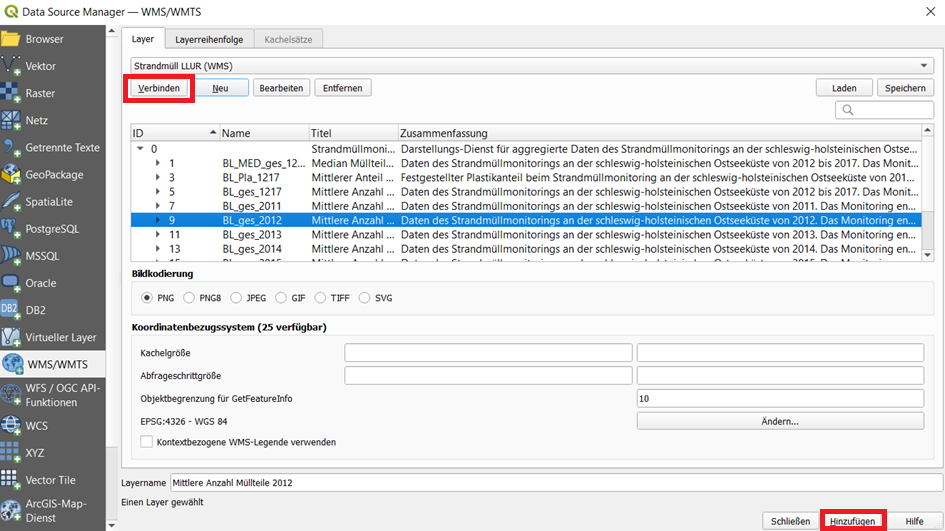
Step 3: Layer selection
- Connect to the service by selecting the service from the list and then clicking Connect. All information about the service will now be displayed.
- Select layer
- “Click “add
- The layer appears in the map and in the layer tree of the application.
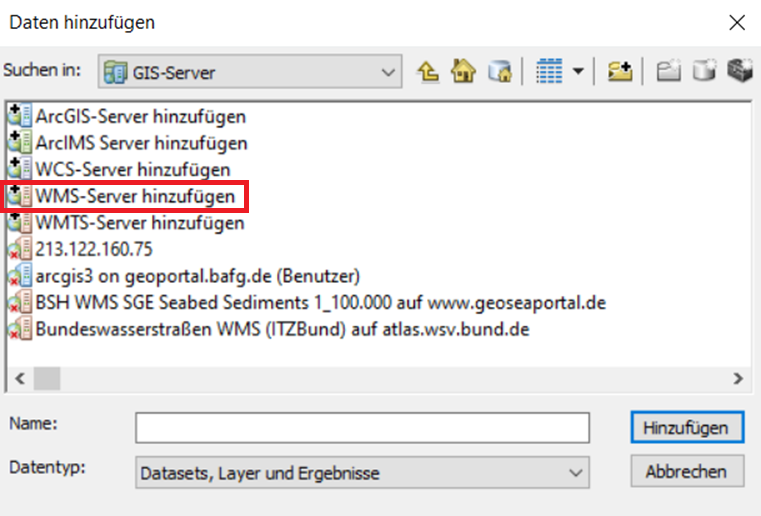
Example ESRI ArcMap (10.6)
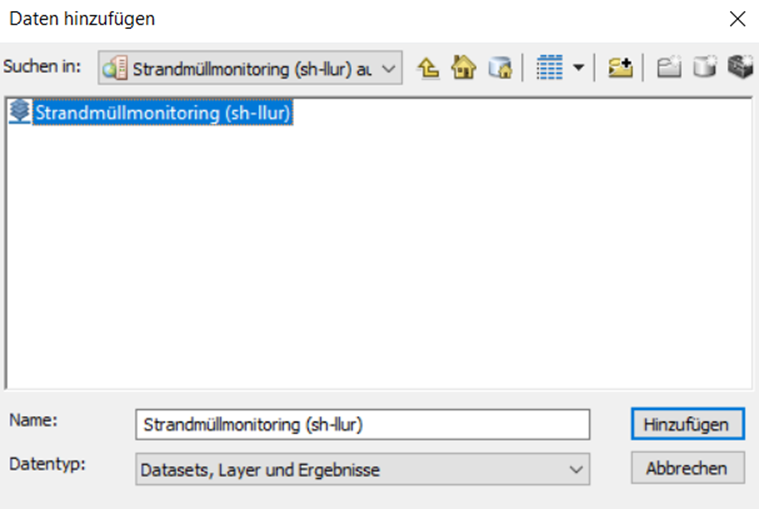
Step 1: File -> add data:
- Click on the “Add data” icon or via the menu item: File -> add data …
- Selection of the service type (in this example WMS)
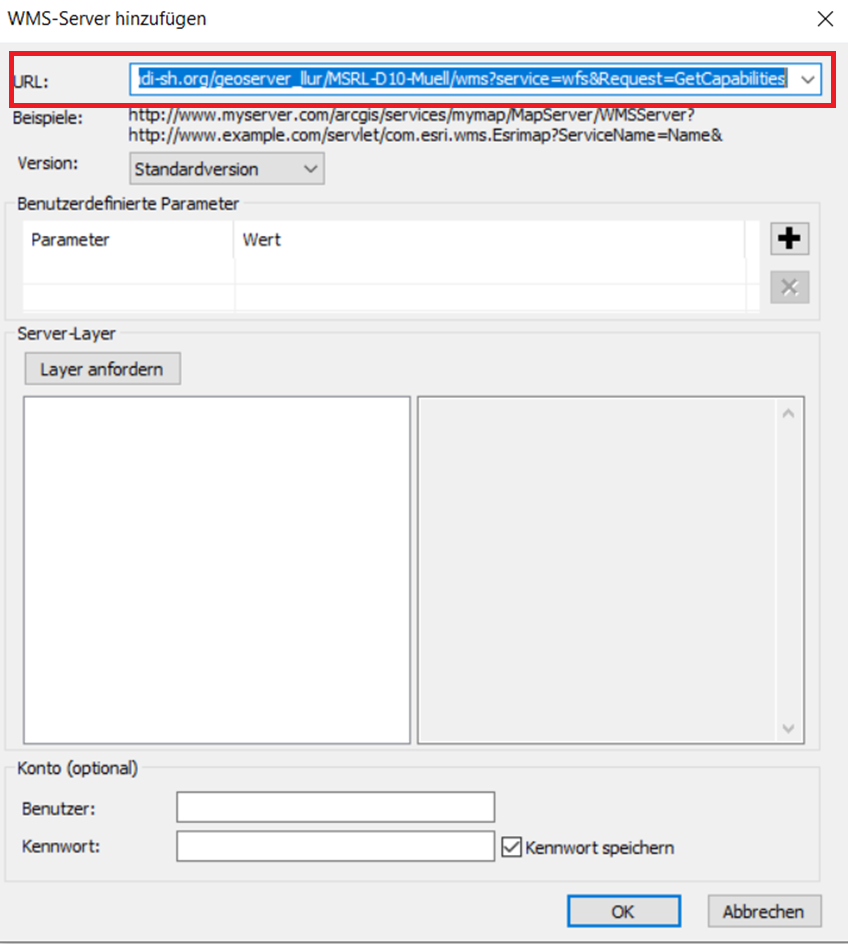
Step 2: Inserting the service address (link/URL of the service or getCapabilities)
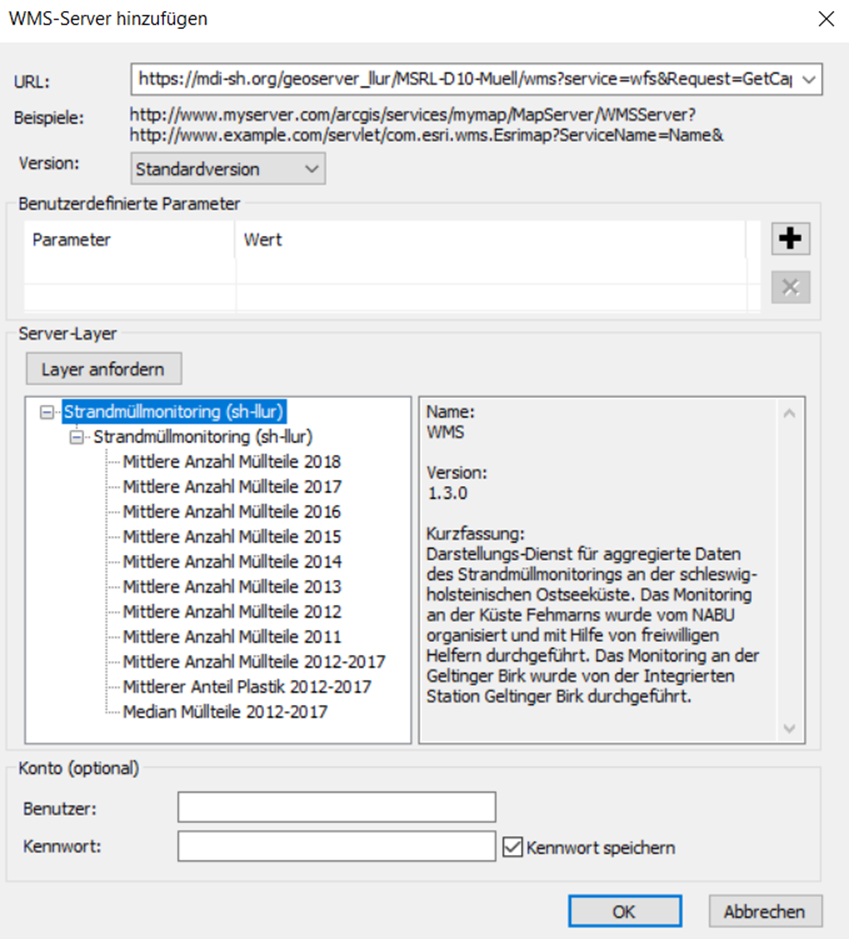
Step 3: Check and information about the service and layers
Step 4: Adding the service